the guiltiest pleasure
Content warning: extremely cringeworthy post.
I need to make a confession. Over the past few years I’ve engaged in a pastime that has taken way too much time and emotional energy away from things like being with family and friends, hearing and making music, reading real books, doing real research, all those real life things.
This is going to be a very lengthy post. The first reason for this is I want to do a braindump of all the stuff I’ve learned on the topic that’s actually useful, and then put it out of my mind and go back to living a normal ass life. Secondly, I don’t want people to read to the end. I want you to drop it (preferably right now!) and never think of it again, because this stuff can be dangerous to your mental health, to your material wellbeing, and to society generally.
So what is this great menace I’ve entangled myself in, you ask. It’s a very dull thing really, which however gets exciting and addictive once you fall for it: online trading.1
Despite my healthy dose of contempt for Wall Street and all it represents, I must admit I fit the ideal “retail trader” profile in several ways:
- I’m an introvert, I like being by myself, growing up I had a great fear of ending up in a job that involves human interaction (which I am so glad I overcame!),
- always liked numbers and probabilities (even if I’m not especially brilliant at math),
- there are parallels between music (as a time-based medium) and the financial markets; in particular, I’ve long been interested in the anticipation of future moves,
- I’m a lazy bastard, I look for big rewards for minimal effort – and I will also spend days upon weeks working on something if I convince myself it will save me time or effort in the long run.
If you see yourself in any of the above, beware! Or if god forbid you’re already stuck in this mire, I’ll tell you what I did to try and get myself out of it.
But first of all, in matters of money you should never take someone else at their word, be they someone on the internet or a close friend. If you want to do this right you need to get a grip of the basics of how markets work, and form a theory of what moves prices.2 A good way to start here is by reading books.
Now, if you still have the good sense not to get involved in the craziness, but you want to know more about the world of trading and the toll it takes, there’s a killer book I 110% recommend to everyone: The Trading Game by Gary Stevenson. Gary’s an ex-trader turned wealth inequality economist with an excellent Youtube channel which you should subscribe to right now.
For the practical side of trading, if you’re gonna read one book it might as well be The Art and Science of Technical Analysis3 by Adam Grimes. The book and its companion free online course are exhaustive, no-BS resources, and together with Adam’s blog and supplemental youtube series you could learn pretty much all you need just from him. Heck, forget actually trading, just absorbing his materials can keep you busy for a pretty long time. His approach, while based on decent quantitative analysis, is mostly geared towards discretionary4 trading. The one thing Adam doesn’t do5 is spoon feed you an edge6 – but we’ll deal with that too, don’t worry.
Another ultra reliable source (and, in a scene full of turbocapitalist bros, probably the most decent guy this side of Gary) is Rob Carver, with his three trading books. Rob comes from the opposite angle to Adam above, in that the strategies he describes can leave room for discretion, but he himself chooses to be 100% systematic. Spoiler: he’s correct. Rob also teaches systematic trading at Queen Mary UoL and is a frequent guest on the Systematic Investor podcast.
The problem with Adam and Rob above is they’re too safe, too buttoned-up. We want someone who’ll show us how to make MILLIONS. Enter security guard turned multimillionaire Kristjan Kullamagi. Sure we might’ve learned about breakouts from those stuffy, serious eggheads, but have they made TENS OF MILLIONS trading them? If so, why don’t they say “TENS OF MILLIONS”7 on their websites, huh? huh? Qullamaggie hasn’t written a book,8 but he’s shared hundreds of hours of trading footage and has amassed legions of followers.
All of this raw knowledge is fine and good, but you also want something juicy (but still informative) to read, some true tales of great trader hijinks of yore? OK, then read Nicolas Darvas and Jesse Livermore, who started the lineage that Qullamaggie&friends are a part of now. Oh, and don’t worry about Livermore going bankrupt several times9 – he was operating in a time before risk management was invented! Lastly, for some modern stories, trader Pete’s blog is fun.
If you’ve been slowly shaking your head about how much nonsense I’ve digested on this meaningless topic, 1) you’re right to do so, but 2) that’s just the best stuff, there’s soooo much more slop that I’ve consumed over these years. And wait, it gets worse. In order to get good at this stuff, everyone agrees that it’s not enough to read books and watch videos. You then need to amass “screen time”10 i.e. look at countless price charts and train your mind and your eye to figure out what various large price moves have in common.
This is done using a tool like tradingview, which lets you screen (filter) for stocks11 satisfying certain criteria. You add these to a watchlist and look at them one by one, trying to anticipate which direction they will go. Then you come back tomorrow, see how well you did, then do another scan, rinse and repeat.
If that sounds tedious and dull to you (and it should!) then you should find a way to do historical scans i.e. check the conditions that you’re interested in, not only for today, but for a bunch of trading days in the past. Then all that’s left is checking what happened to your candidates subsequently.12 To my mind this is the best way to validate trading ideas.
I’m pretty sure there are paid tools out there that enable historical scanning, but I built one myself in Python. I’m not going to share my code here btw, we’re in the age of ChatGPT and Copilot, this is basic stuff that’s pretty easy to program.13 What you will need is a database of historical price data for all stocks, avoiding survivorship bias. I got my data from databento; it’s probably not the best solution but also not the worst. The data is pretty clean but certainly not perfect, the repercussions of which we shall soon see. I chose databento because they offer a bunch of free credits when you sign up, which will get you all the data you need to get started.14
Now, what exactly are we looking for when we do these scans? What constitutes a good trading idea? These questions are closely correlated to the larger question of what is your trading objective? If you’re in a position where you’ve got some savings and want to invest in a safe manner for the long term, you can follow Gary and Rob’s advice15 and put your money in some stock ETFs and maybe some bonds and gold. That’s investing, not trading (aka gambling), and it’s what reasonable people do. Say you want a bit more action, then you can implement a system based on Rob’s books or his blog – his approach is based on continuous forecasts, meaning you’re constantly trying to anticipate where the instruments in your set are going, and adjust your bets accordingly. His systematic approach to position sizing16 ensures that you’re not taking on more risk than you plan to, while getting (on average) larger returns than the pure “buy and hold” investing model.
My situation is this: I’ve got a (very) small amount of disposable income, half of which I’m saving/investing as described above. The other half I’m directing to a speculative trading system which should deliver outsized returns (while keeping the risk in check as much as possible). That’s why all these kids are looking at charts all day – they’re trying to identify the opportunities which, over a large enough sample, will skew the odds in their favour to a significant degree.
Each of these trade ideas can be developed into full strategies, which you combine into a system. Having several uncorrelated strategies working at once is nice,17 the idea being that when one of them isn’t making money, another one is.
How can you gain confidence that a strategy will work? First, it should align with your theory of how markets move (remember, that’s where we started), and you should see it play out (or fail!) over many instances in the past. Secondly, it should perform well in a quantitative backtest. Now, the issues with backtests are a can of worms which I won’t open here, but a simple backtest is essential to give an idea of how your strategy would’ve performed over a series of historical regimes, over your universe of stocks (including ones who were unlisted). There are paid services for this (which I didn’t touch)18 and there are backtesting libraries for Python (which don’t have great support for trading multiple stocks simultaneously)19, but again I chose to build my own from the ground up.
Before I disclose my precious strategies, I want to enumerate the advantages of systematic, fully automated trading over the “classic” discretionary way:
- time. You do not have to spend hour after hour, day after day (or in my case, night after night), looking at charts and pressing buttons. Even if you decide to trade once a day, or a week, you still waste so much time building and browsing your watchlists and making all sorts of decisions. As opposed to simply ensuring your program is running correctly, which usually takes no time at all.
- action. Even if you have all the insights and make all the right decisions, having to pull the trigger manually takes a big mental and emotional toll. Trading can be stressful in so many ways, it’s so much better to let your system take all the shots and for you to simply check that the drawdowns (which inevitably come) are within the parameters you’ve estimated.
- decisions. Who actually makes all the right decisions, right on time? There are a few “elite” traders who get super good at this after years of practice, but I’ll never be one of them. So if we agree that mistakes are inevitable, why not trade them off for the planned imperfections of the algorithm.
- backtesting is unreliable enough as is; when you include human judgment as a step in the process it becomes even more so.
- self-optimization. You might see this fall under “discipline” or “psychology”. Discretionary traders start by setting up routines, journaling, etc. So far so good. But then, if you’re serious about it, you’ll treat these processes and data as something to be perfected (just like the other components of your trading plan) to bring yourself in alignment with your edge in the market. You become a human algorithm. Worse than that, it can spill over into the real world, where you start seeing life as this quantifiable, winner-takes-all sort of game.20
So, when you look at the armies of retail traders deciding to trade manually, it boils down to one or several of the following:
- they think trading is fun / cool / makes them feel part of something bigger.21
- they don’t have the programming and/or data analysis skills.
- they think they have some sort of human intuition or “an eye” for certain patterns, which cannot be programmed into an algorithm.22 Now, that might well be true for a select some,23 but my challenge to them would be: automate all of your system except for your “human edge”, then test it against an equivalent fully automated system. How much better do you perform, and is it worth all the drawbacks I’ve mentioned above? Again, for me this question is a no-brainer.
- they claim that the practice of trading is how they generate new ideas and adapt to changing market dynamics. This I don’t have a strong argument against (other than to say AI is probably coming for you too);24 still, I would say there are less stressful ways to study the market.
OK, so here are the two strategies I’ve implemented. They’re inspired by the traders mentioned above (and the many whom they’ve influenced), and validated by seeing them in action on countless charts and through backtesting on my dataset.
The Qullamaggie-inspired breakout looks like this. Here’s a setup – you’re supposed to buy on the next day (at the right edge of the screenshot) if prices go higher:
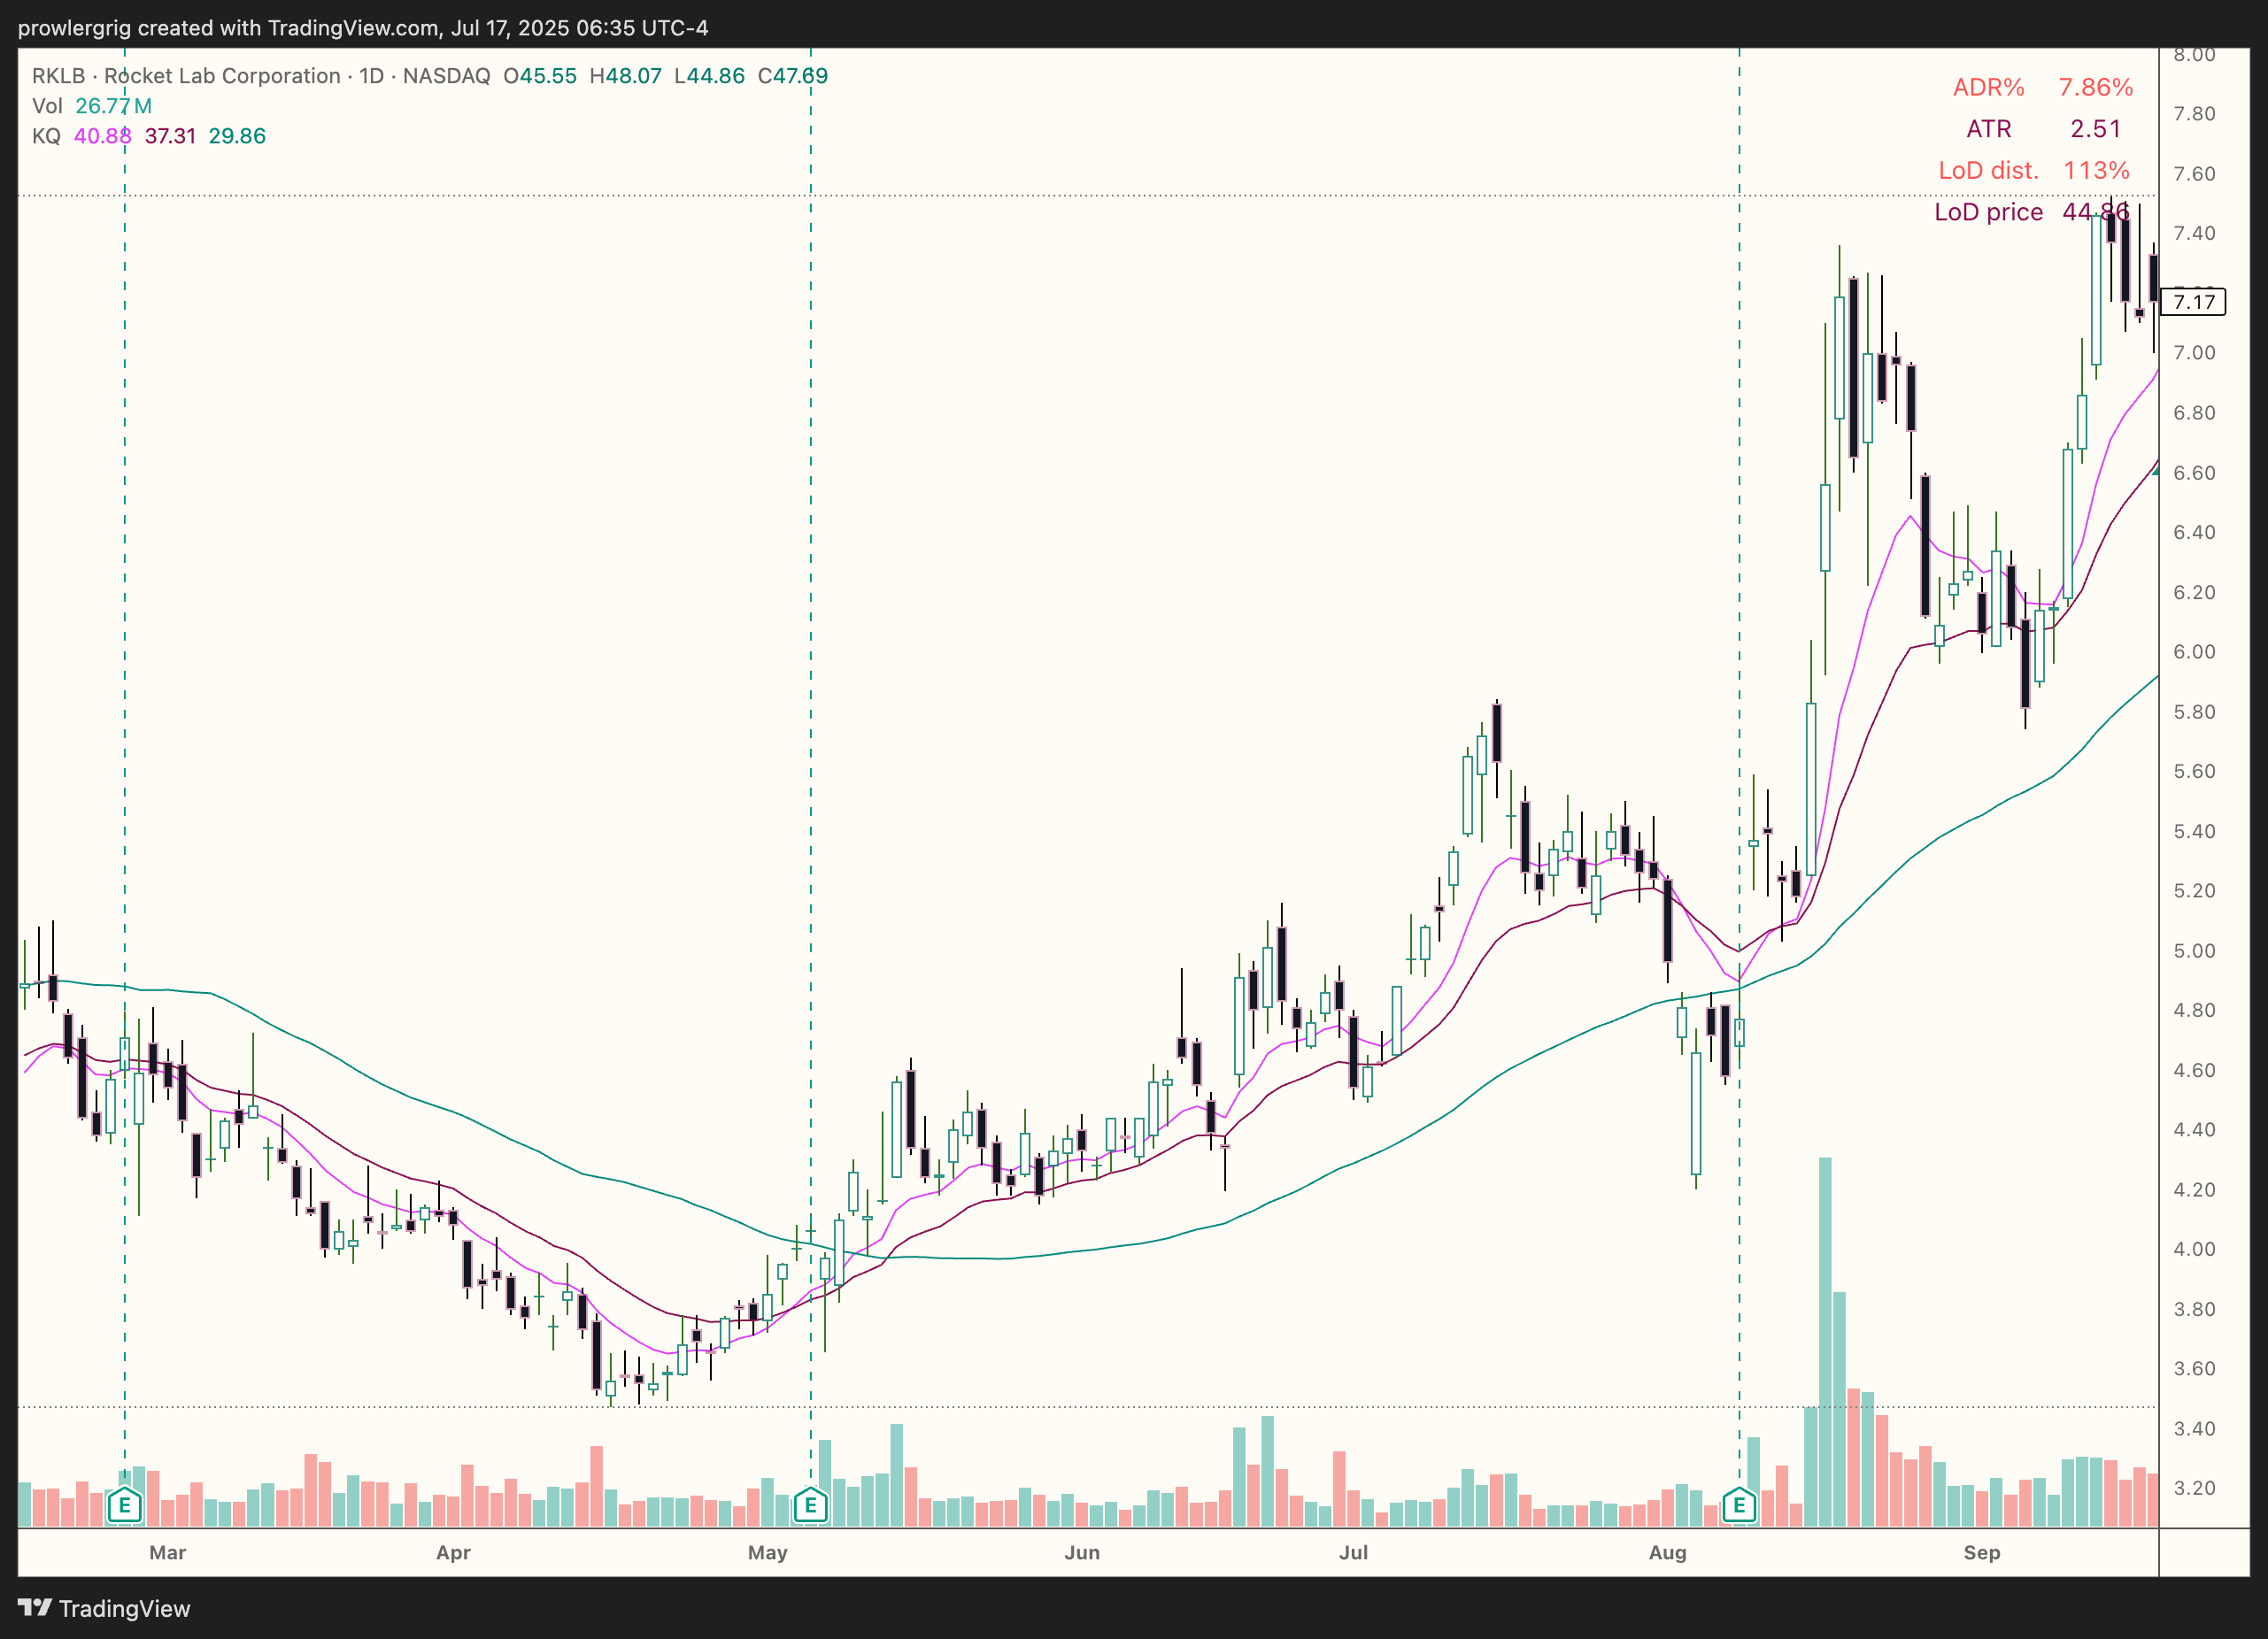
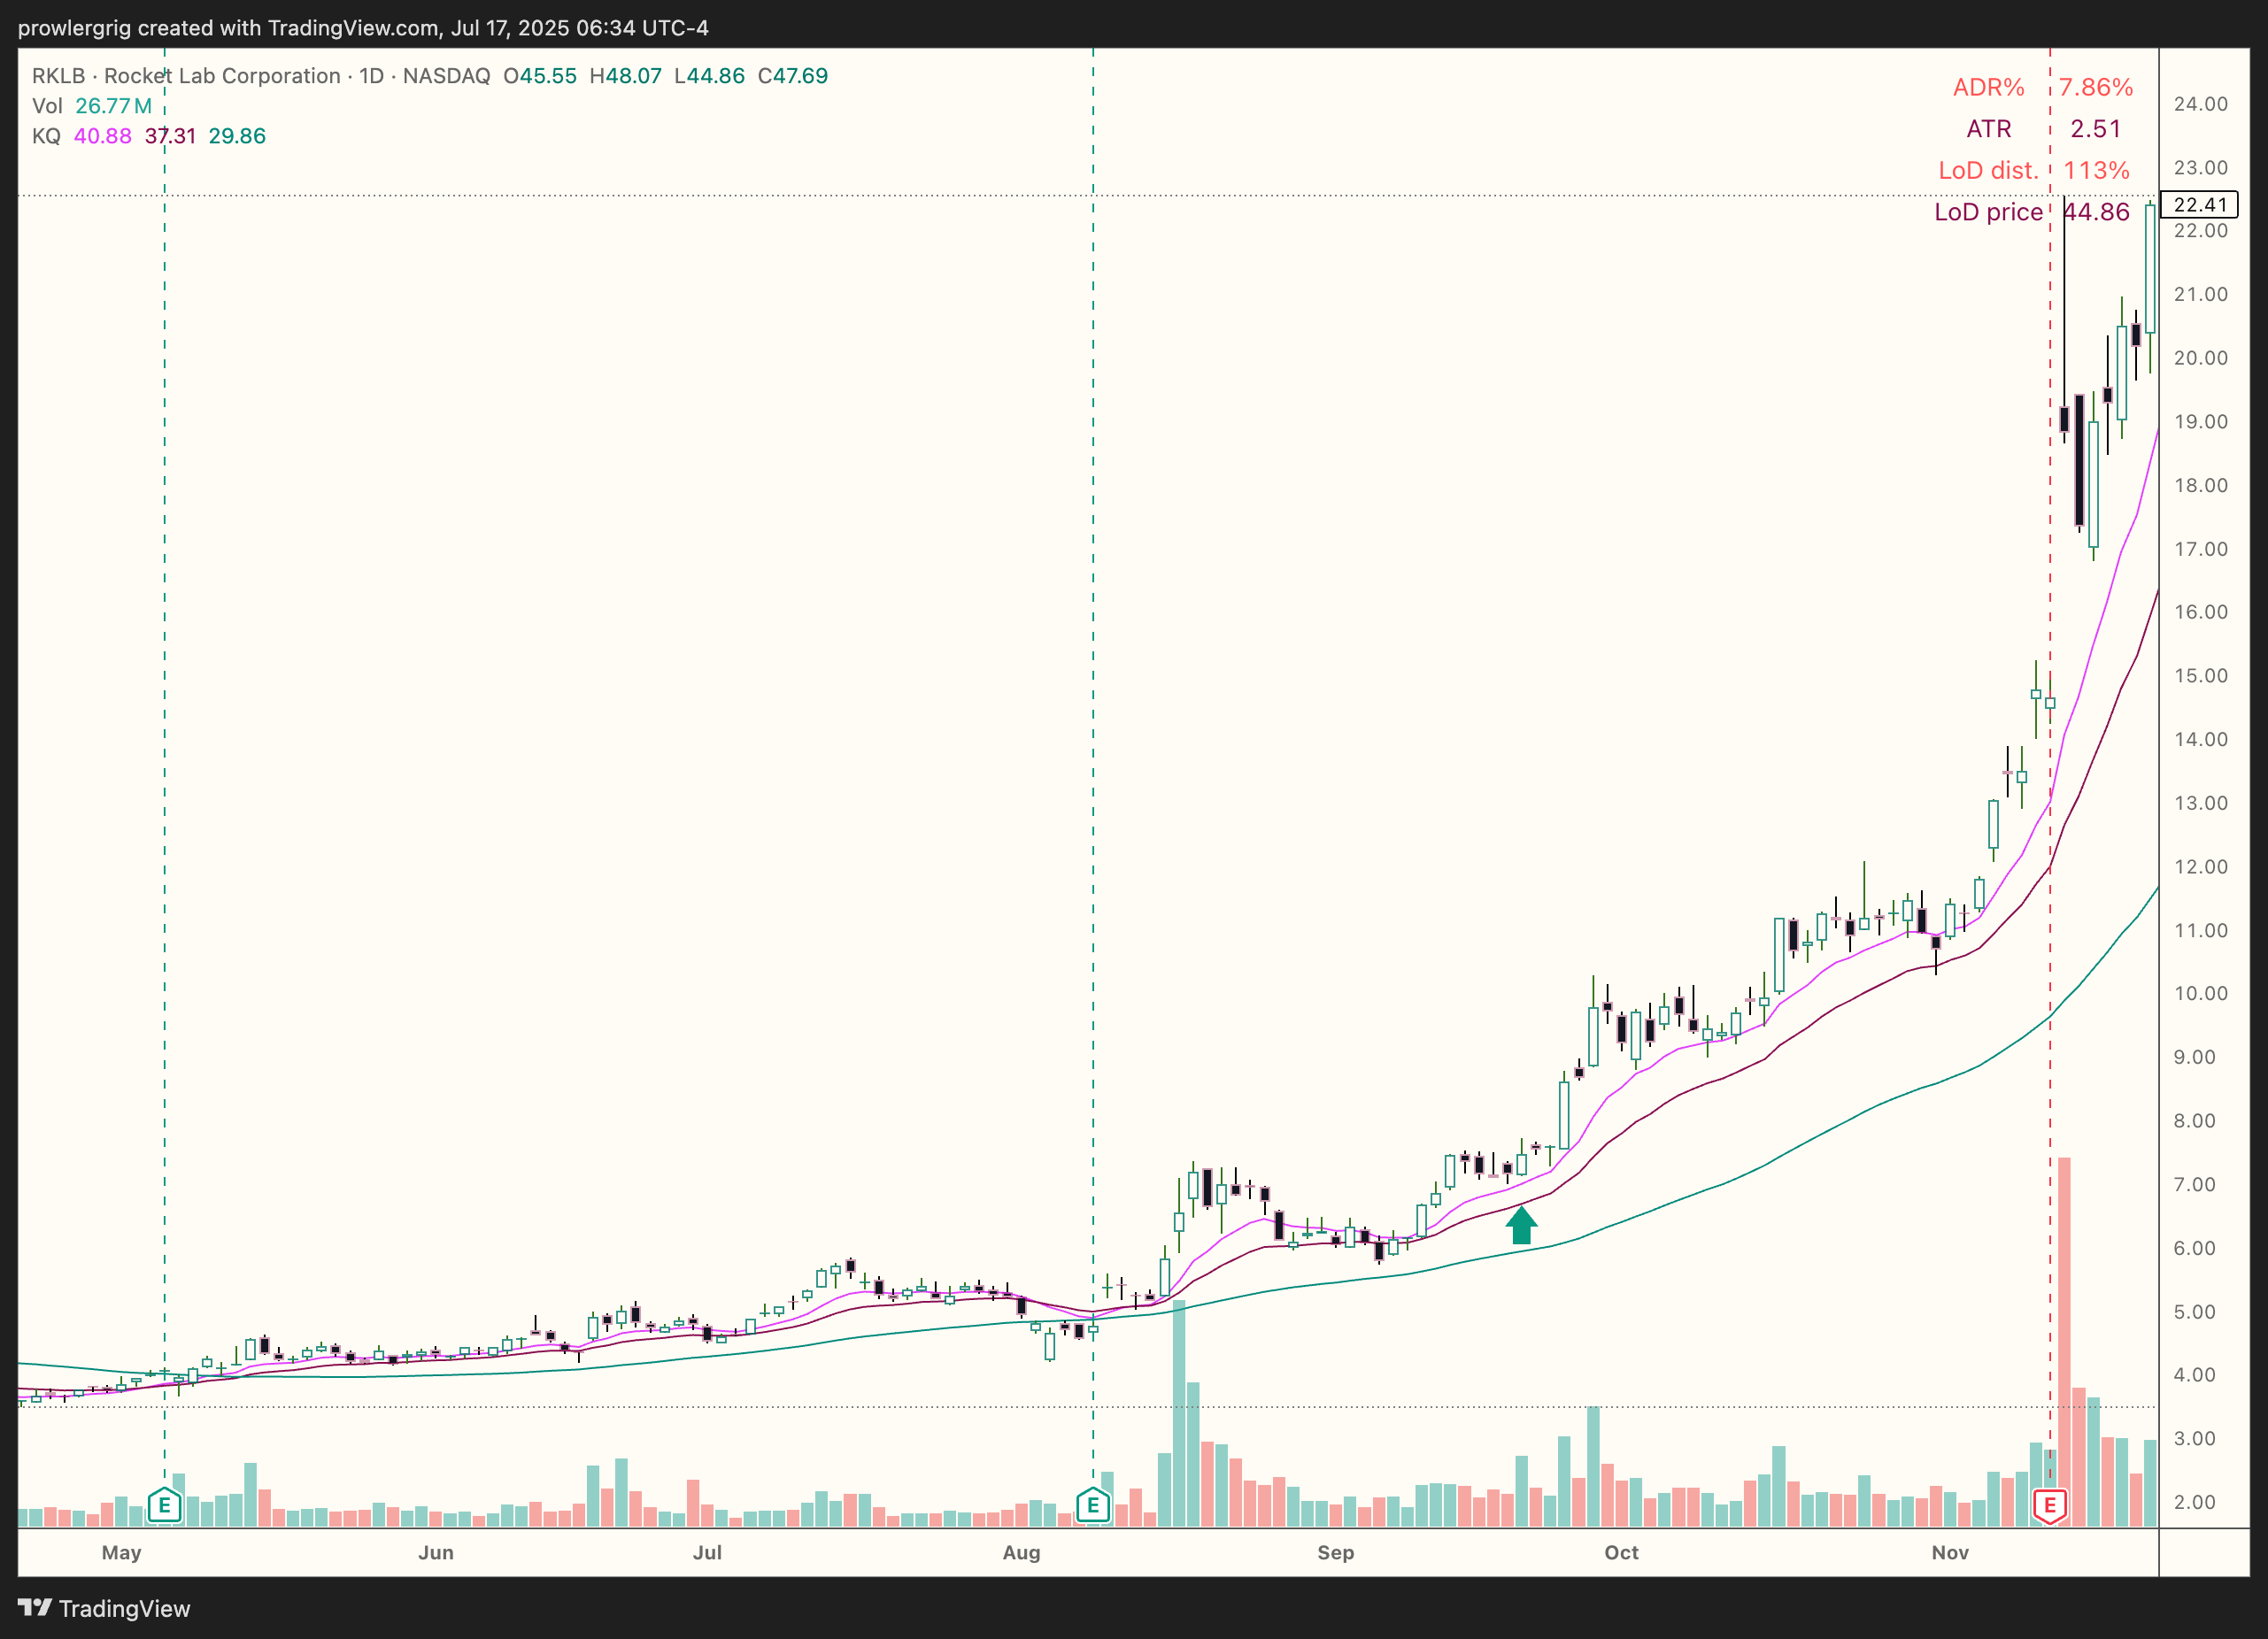
In this case the stock did break out (the green arrow points to the day after the setup), and kept going higher for quite a while:
The setup is found through the following scan:
- At least 30% performance over the last 30 days, and 50% over the last 6 months. The stock price must’ve grown recently. I order candidates by the 30-day performance value.25
- ADR > 3.5%. I’m looking for stocks with medium to high volatility, that (in the recent past) have moved around 3.5% or more daily and so are favoured to make big moves in the future.
- Dollar Volume > $500k. The stock must have a certain liquidity so that I can trade it safely. The 500k threshold is very small, but so is my account size. As your account grows you need to raise this level.
- 5-day range < twice the ADR% * price, and 10-day range < four times the ADR% * price. This means the price fluctuations have been contracting in the past 1-2 weeks, getting ready for the next leg higher.
- Price in the vicinity of EMA20. If price is still near the average, it could be close to breaking out.
- EMA20 > SMA200. The faster average is higher than the slower one, meaning the overall trend is up.
- At least 2 recent higher lows. I count the recent pivot lows going higher, uninterrupted by lower lows.
Now that we’ve filtered for a list of candidates, we’re not going to simply buy every one. We wait for the setup to trigger, which in my case means that on the next day, the closing price26 needs to have surpassed the closing price of the last 8 trading days. This means the stock has broken out and it’s time to buy it. How many shares? The position size depends on the ADR% (the more volatile the stock, the less we’ll buy of it) and, of course, the price as a fraction of the entire account value.27
Finally, nothing goes up forever, so we need to decide when to exit the stock. I set an initial stop loss order of 1.5 * ATR below the entry price. Then, as the price moves up, we trail the stop loss accordingly. Moreover, if the EMA20 catches up and the price closes below it, we also exit.
Plug all that into a backtest, and the result is something like this:
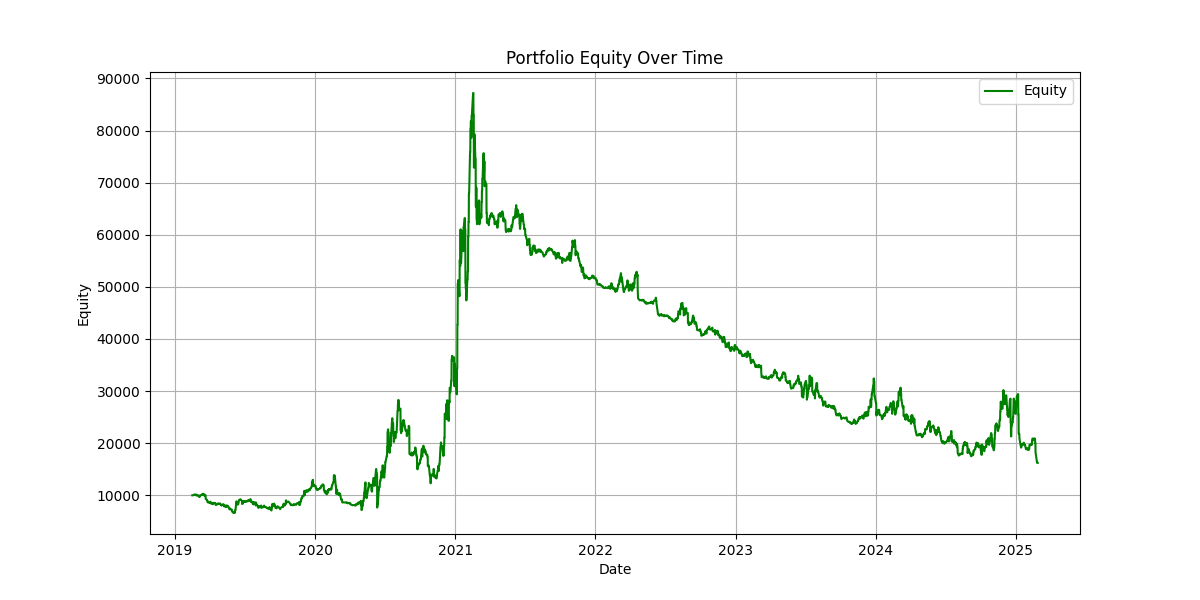
Not great at all. 2020 going into 2021 was an anomaly, you cannot rely on that performance.28 The rest of the time, the strategy is consistently bleeding money. A pretty depressing result, after all this work. I tried changing the filters, messing about with rules29, to no avail: there were still simply too many small losers.
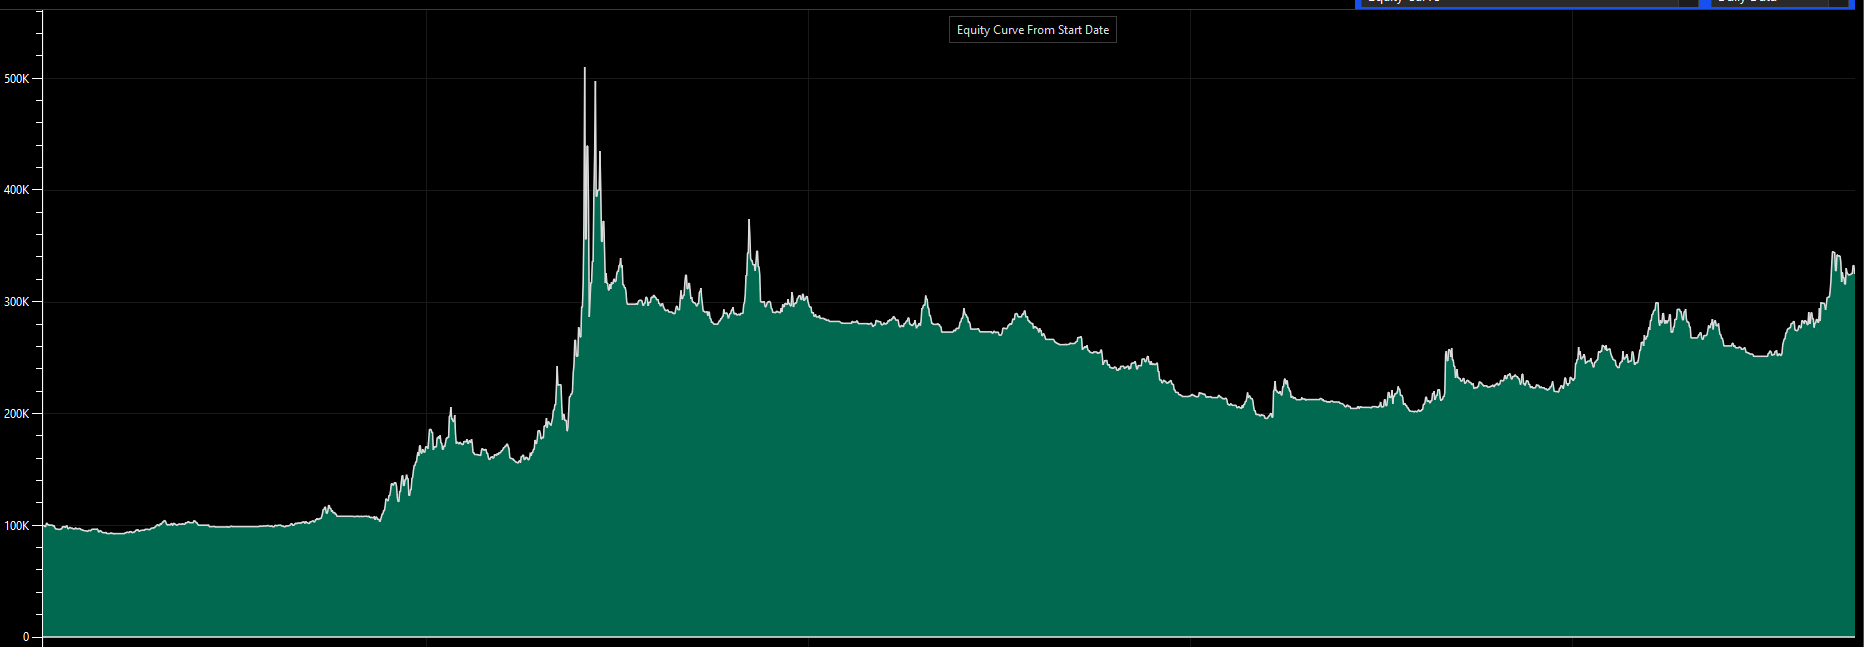
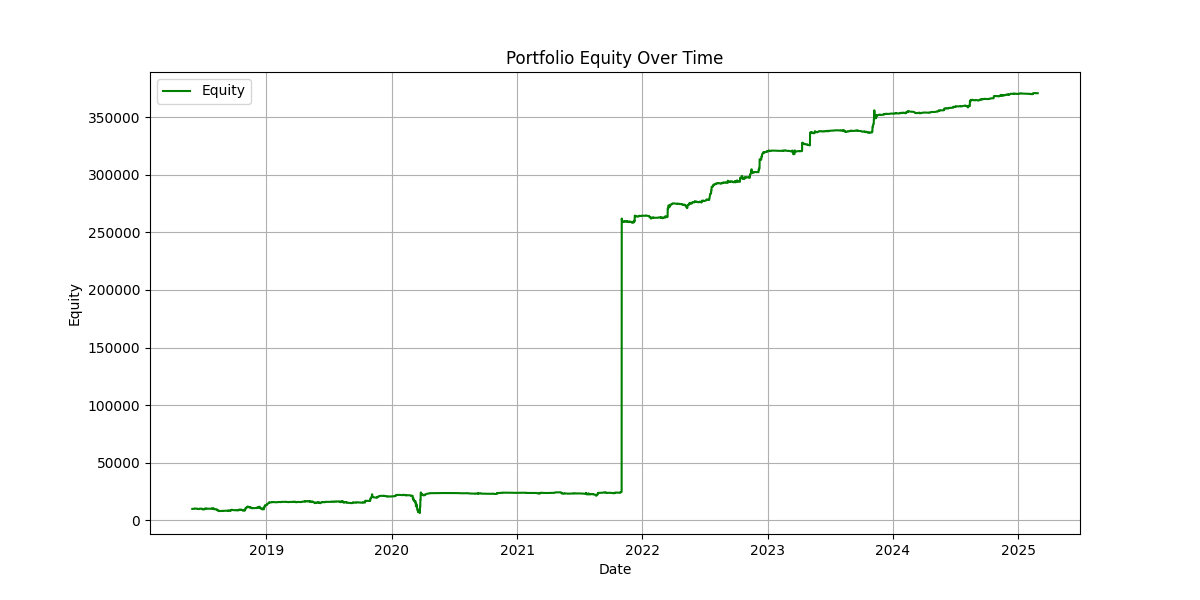
But I figured it out, of course I did. The solution is a tactic I’d never been that sure about, which is why it wasn’t my first instinct to include it. I replaced the trailing stop loss with a breakeven stop.30 Here’s my implementation: on day 4 of the trade, move the stop loss up to the entry price,31 guaranteeing that if the price ends up going back down, your loss will be negligible. Here’s the resulting backtest:
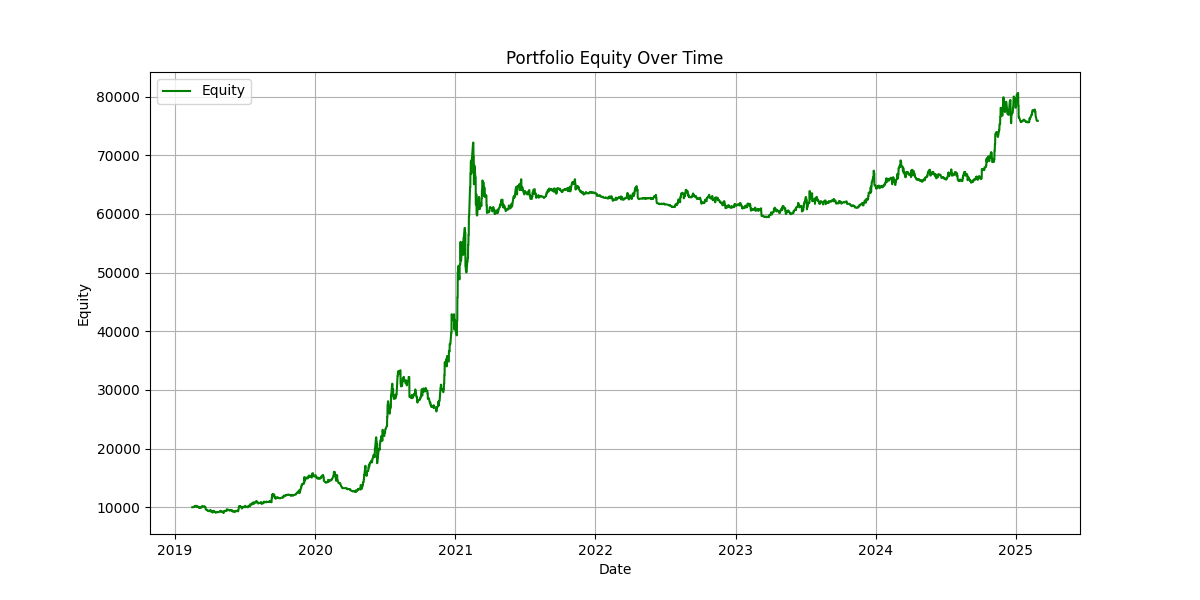
Much better, no? Long periods of sideways, punctuated by big jumps32 when breakouts are working. We now know to expect months, even years, of not much going on (but also not losing! Compare this curve to what the S&P was doing in 2022), because eventually the wait will pay off. And because it’s all automated, the dry period doesn’t involve grinding through charts day in and day out, potentially taking silly risks to force a result.33
EDIT ONE MONTH LATER
To verify these backtest results, I re-implemented the whole strategy in Tickblaze34, which enables more stats, multiple strategies, annnnnd… broker commissions. The more skeptical among you might have asked if the equity curves presented above included commissions, and, while my python script did roughly compute them, it couldn’t include them in the performance graph. Now, if we do, the picture becomes sad again:
I worked a bunch to lower the amount of trades taken (and implicitly the commissions paid) and to find a way to prioritise potential winners. Here is what finally seemed to work:
- Ordering candidates not by performance, but by daily dollar volume. Stocks with a lot of activity have higher odds of going higher. I also tested relative volume and it didn’t perform as well.
- Selecting only a fraction (I use 12.5%, or 1/8) of the scan results. Say a scan produces 40 candidates, I will only consider the top 5. This works very well as a continuous regime filter: unfavourable periods (like 2022) produce thinner scans, so for example on days when less than 8 candidates pass my filters, no trades will be considered. Indeed, looking at my stats, losing years (2022, 23) have way fewer trades than winners (2020, 21, 24, 25 so far) which limits the drawdowns.
- Set the breakeven stop to 3% above the entry, to help compensate for trading costs.
- Some filter adjustments: 5% minimum ADR, 5 days until move to breakeven…
All of this brings us back to the more optimistic equity curve:
I’ve tested this variant with various parameter values and the overall shape remains. One possible exception is the fraction of scan results: increasing it too much breaks the edge. Here are my indicators and strategy code and the list of positions in the backtest.
END OF EDIT
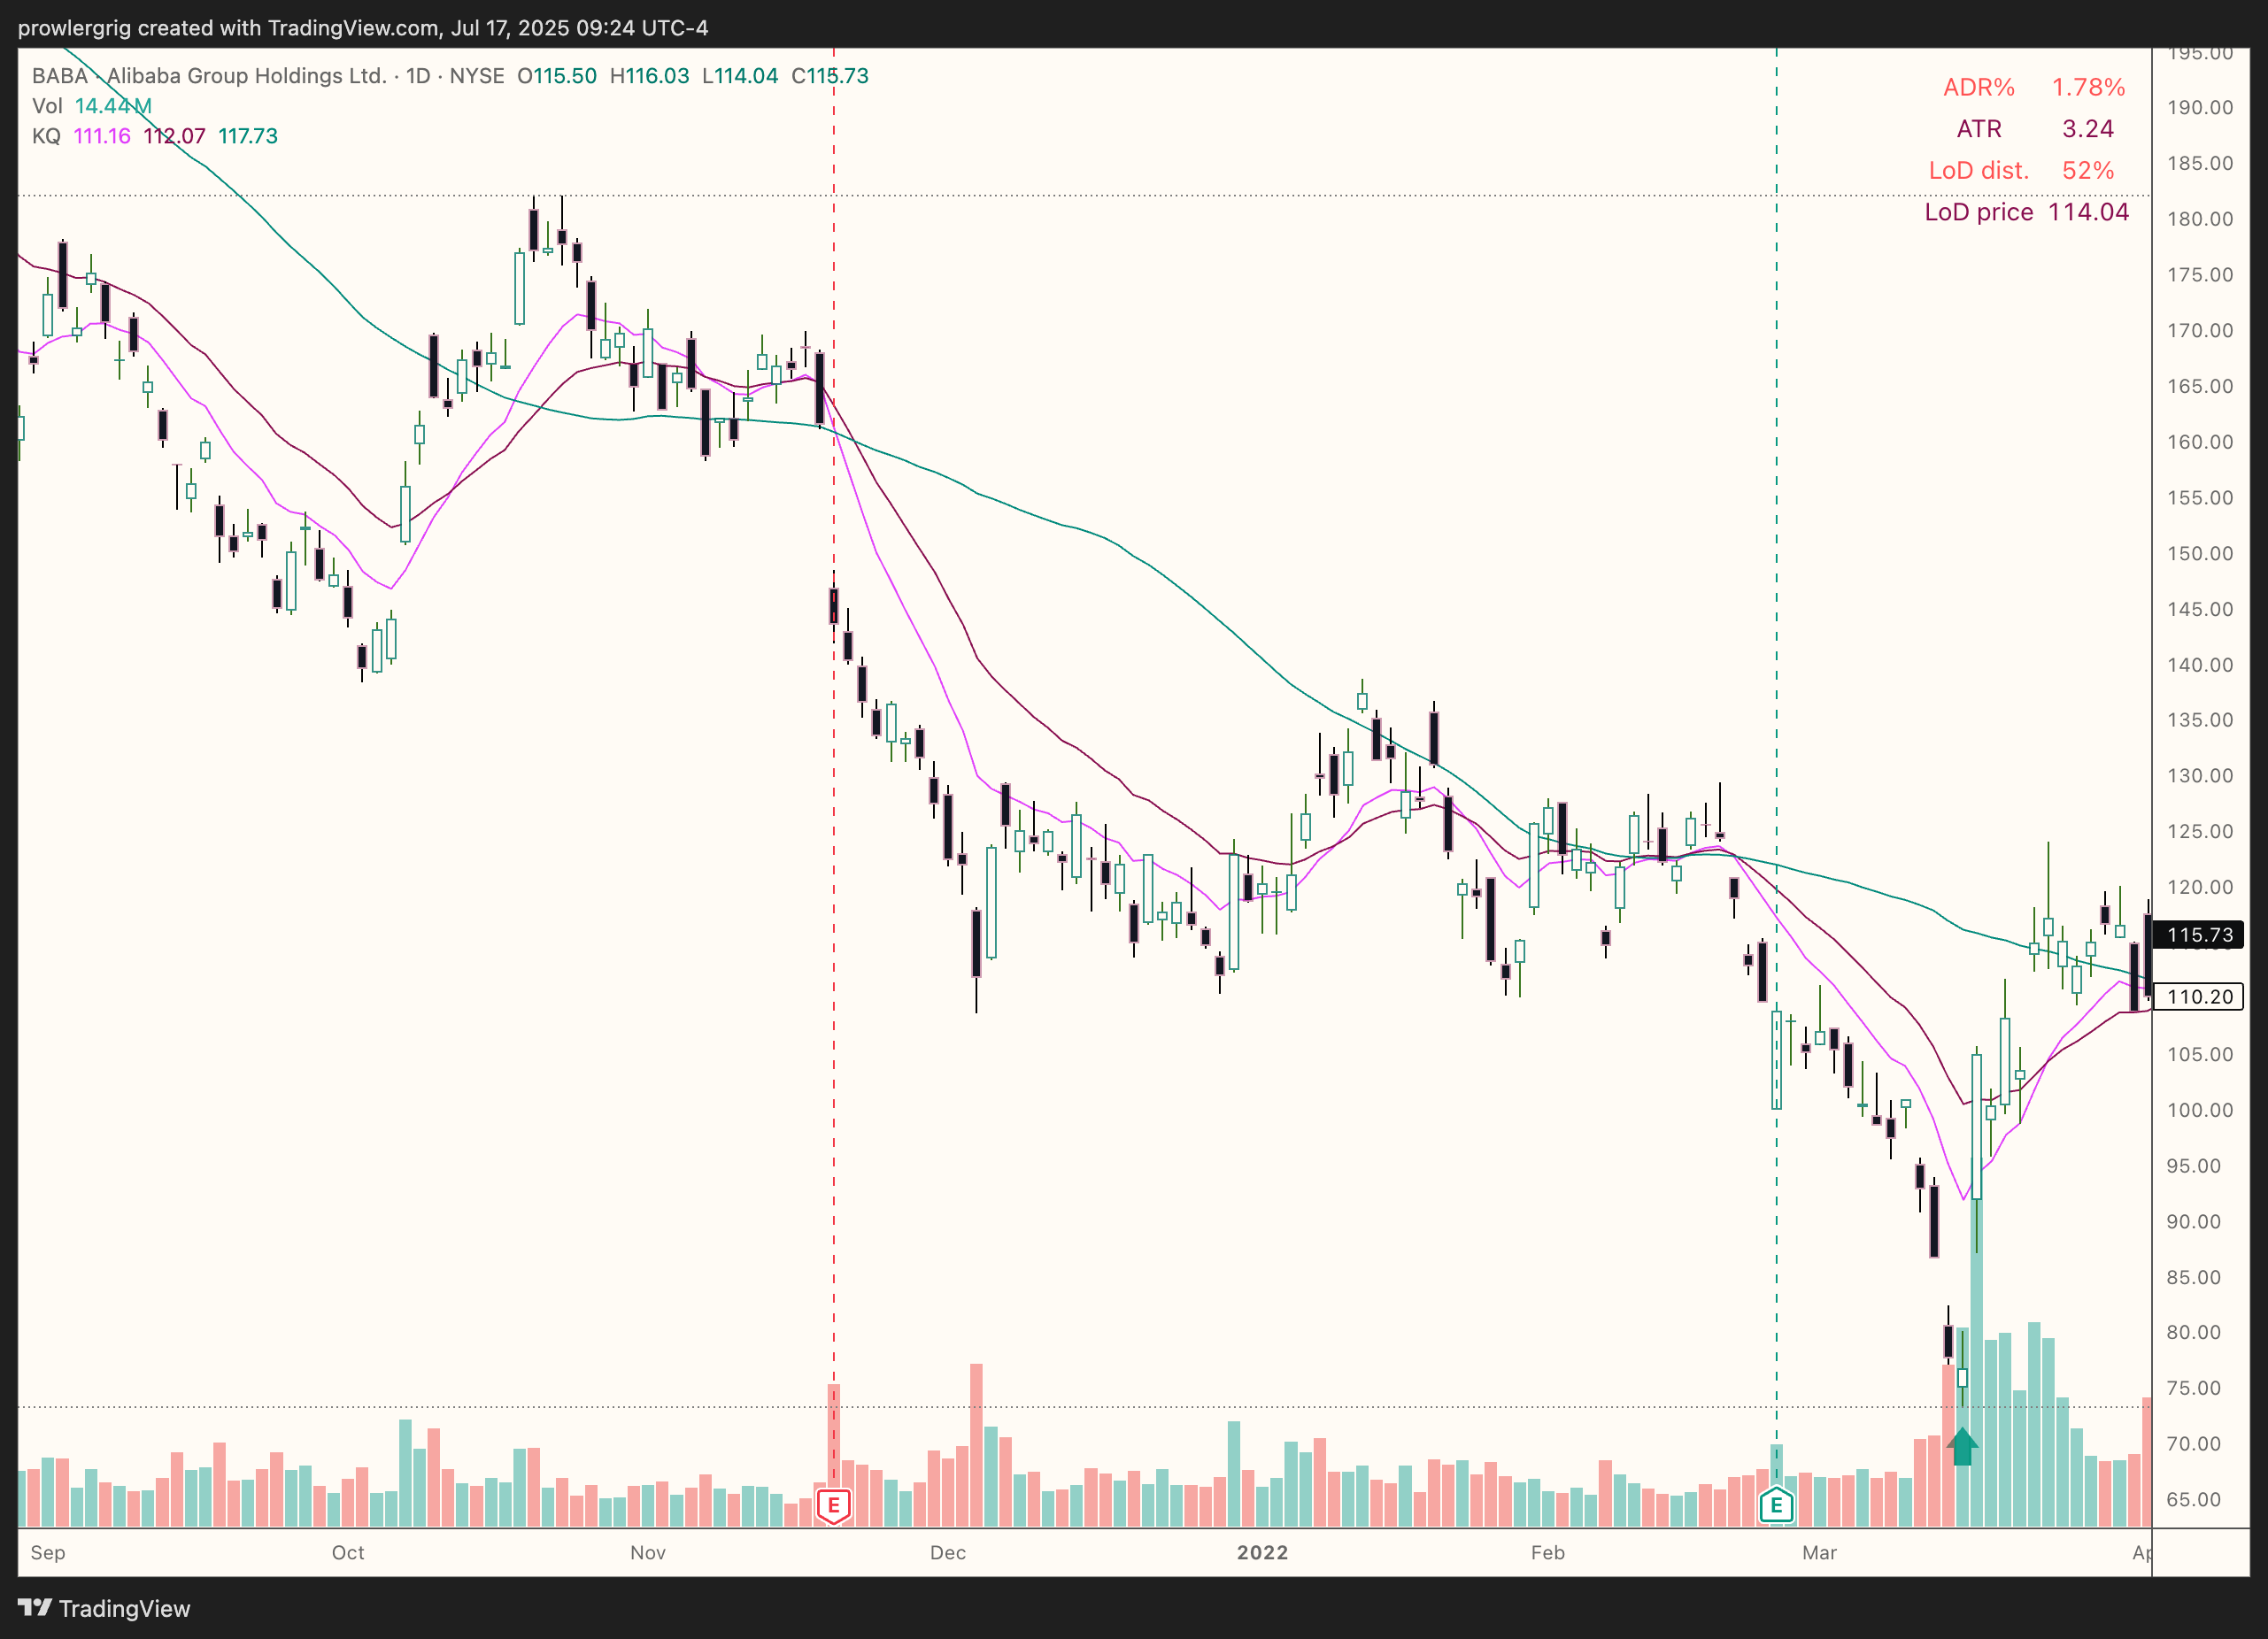
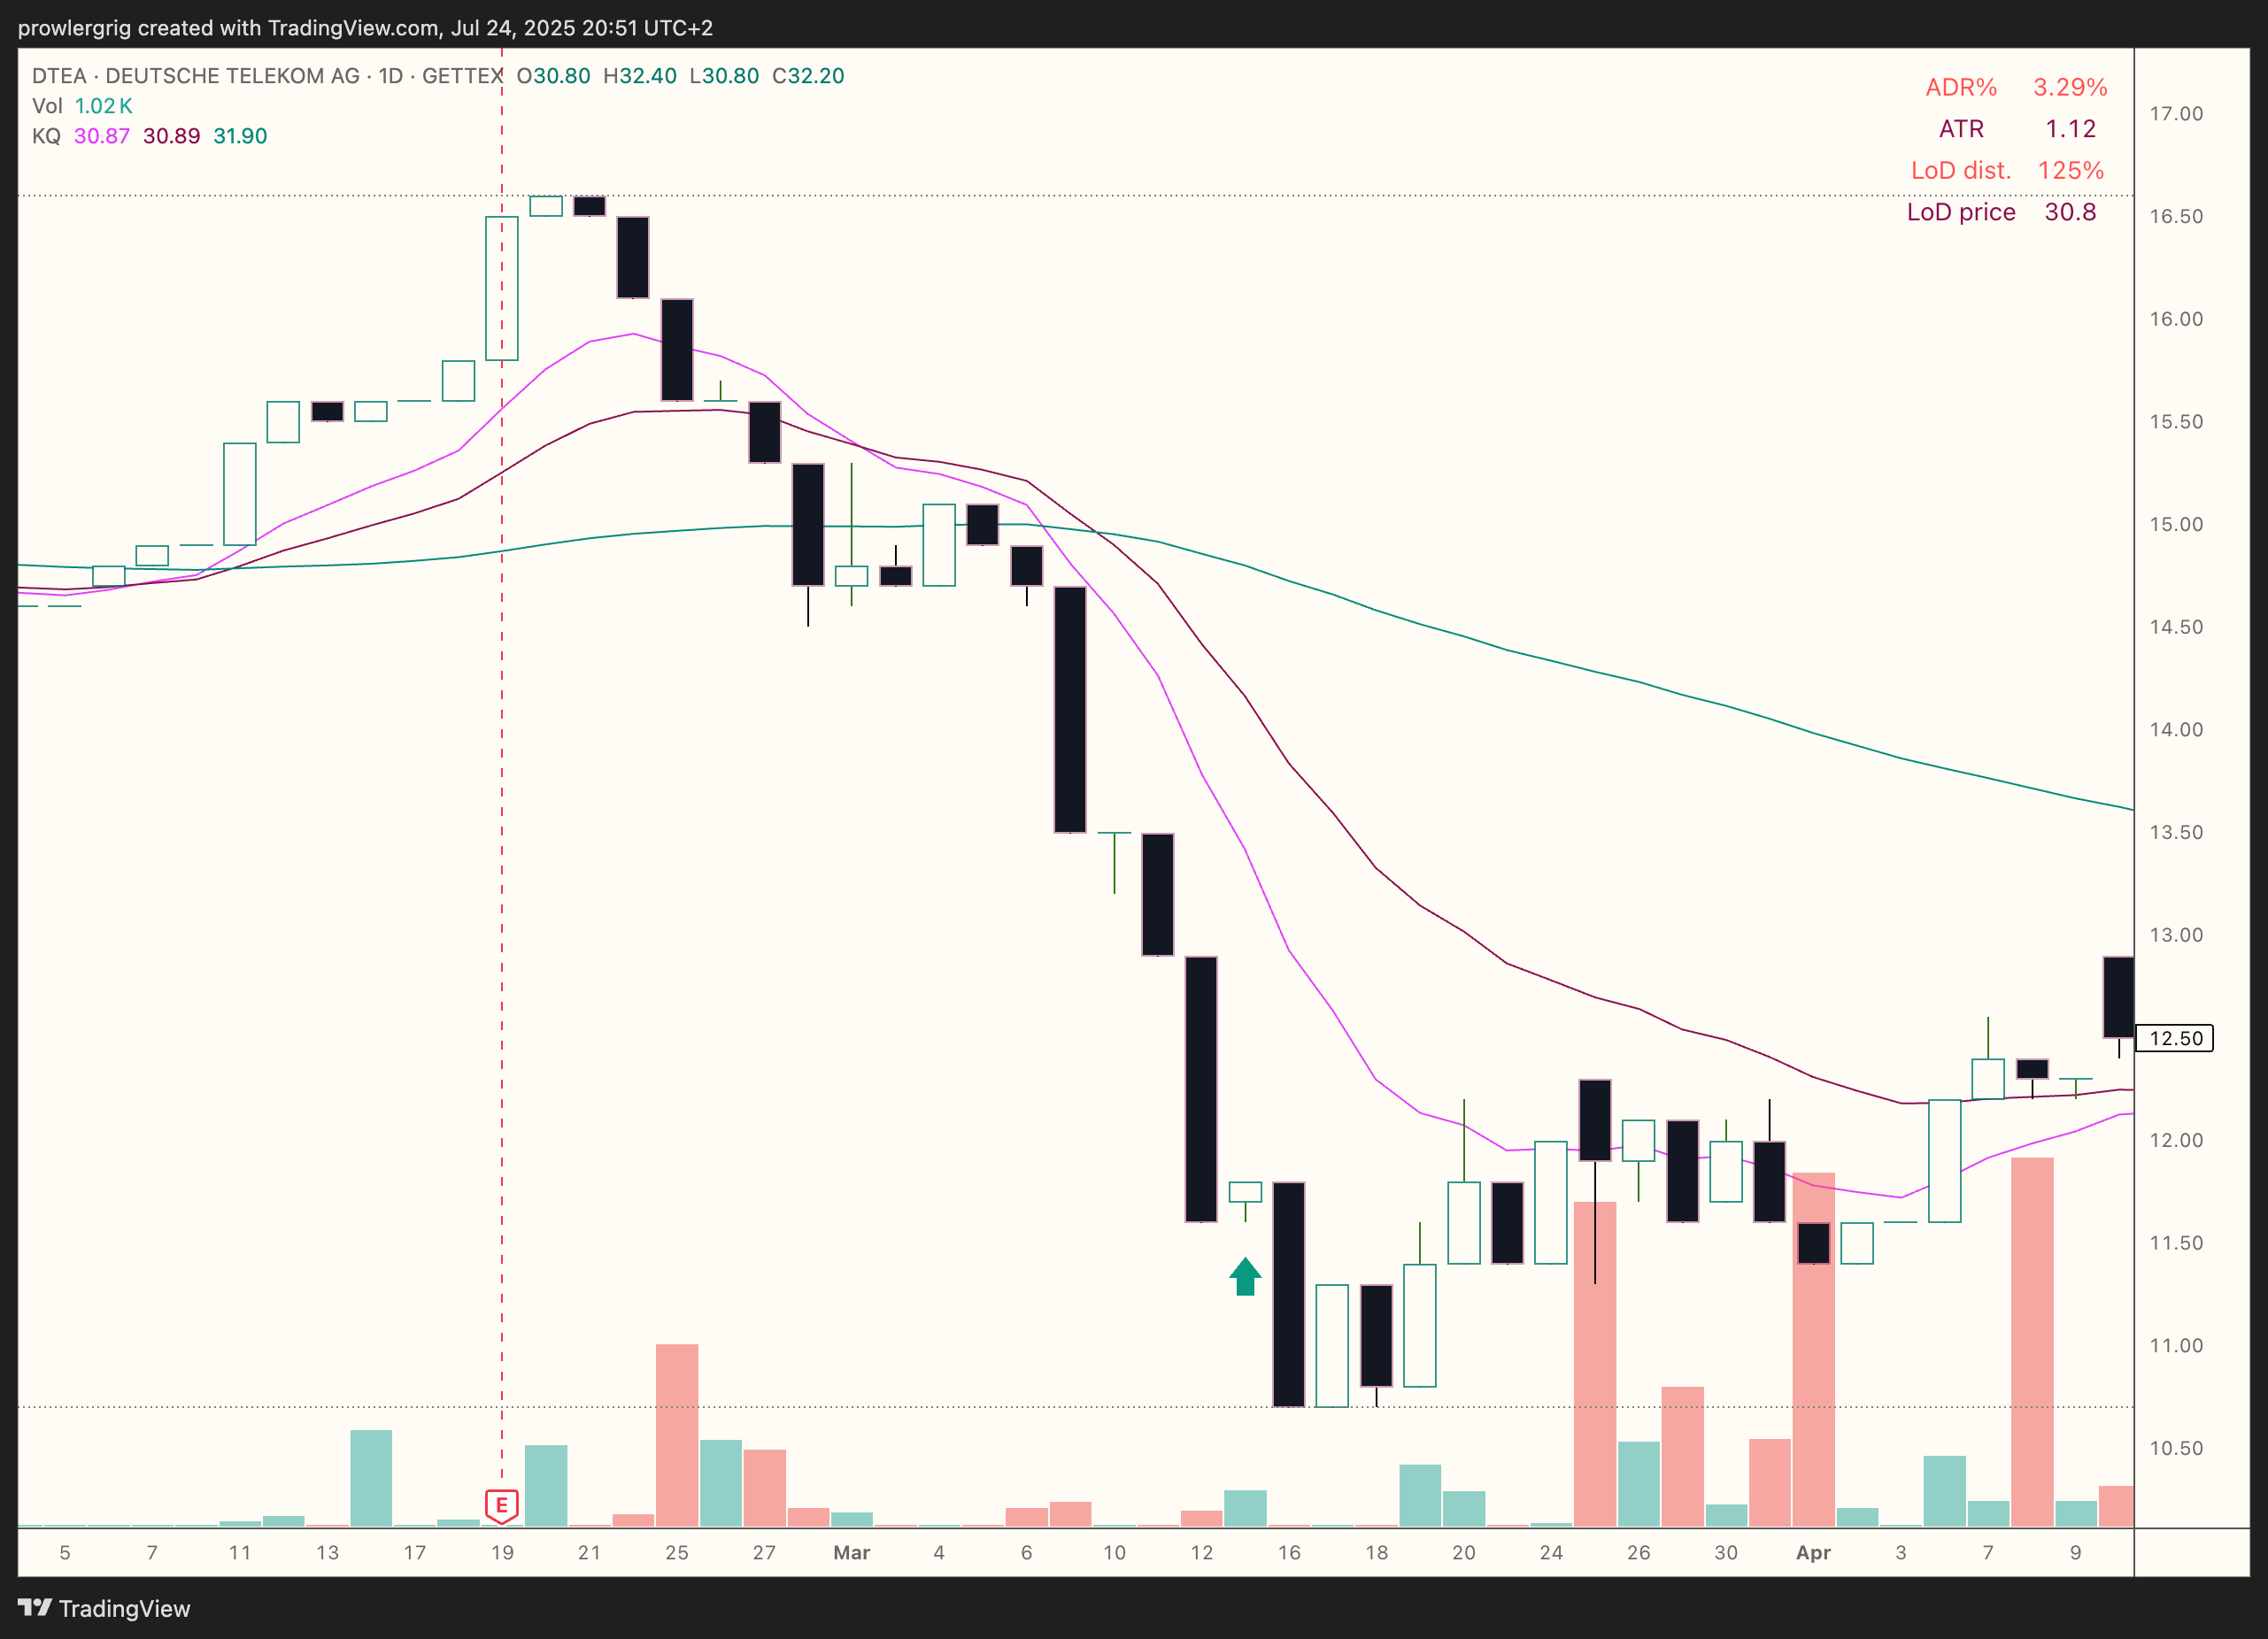
It would be nice to complement these results with something else. Enter Strategy #2, the parabolic long. Again, here’s a typical setup:
This case is the opposite of the breakout, we want to go against the trend and capture stocks that are extended to the downside, and due for a (usually pretty quick) snapback. In this case, the rebound ended up being pretty significant:
Here are my parabolic long scan criteria:
- ADR > 4%. This should probably go even higher.
- 5-day range > 3 * ATR. Contrary to the first strategy, we want the stock to have made an unusually large move in the immediate past.
- Price is at least 3 * ATR lower than the EMA20, significantly extended below the moving average.
- Volume is at least twice higher than average. There must’ve been significant trading activity pushing the stock lower.
This gives us a list of extended stocks, but how do we know they won’t extend further down? Well, the trigger is to buy only the candidates with a “green day” i.e. when the stock closes (usually for the first time in a few days) higher than where it opened. Again we have an initial stop loss of 1.5 * ATR beneath the entry. This time just moving to breakeven doesn’t make sense; we want to be more aggressive with capturing the snapback. We raise the stop to each new higher low-of-day, so that our exit will be on the first day that prints a price lower than the low of the previous one.
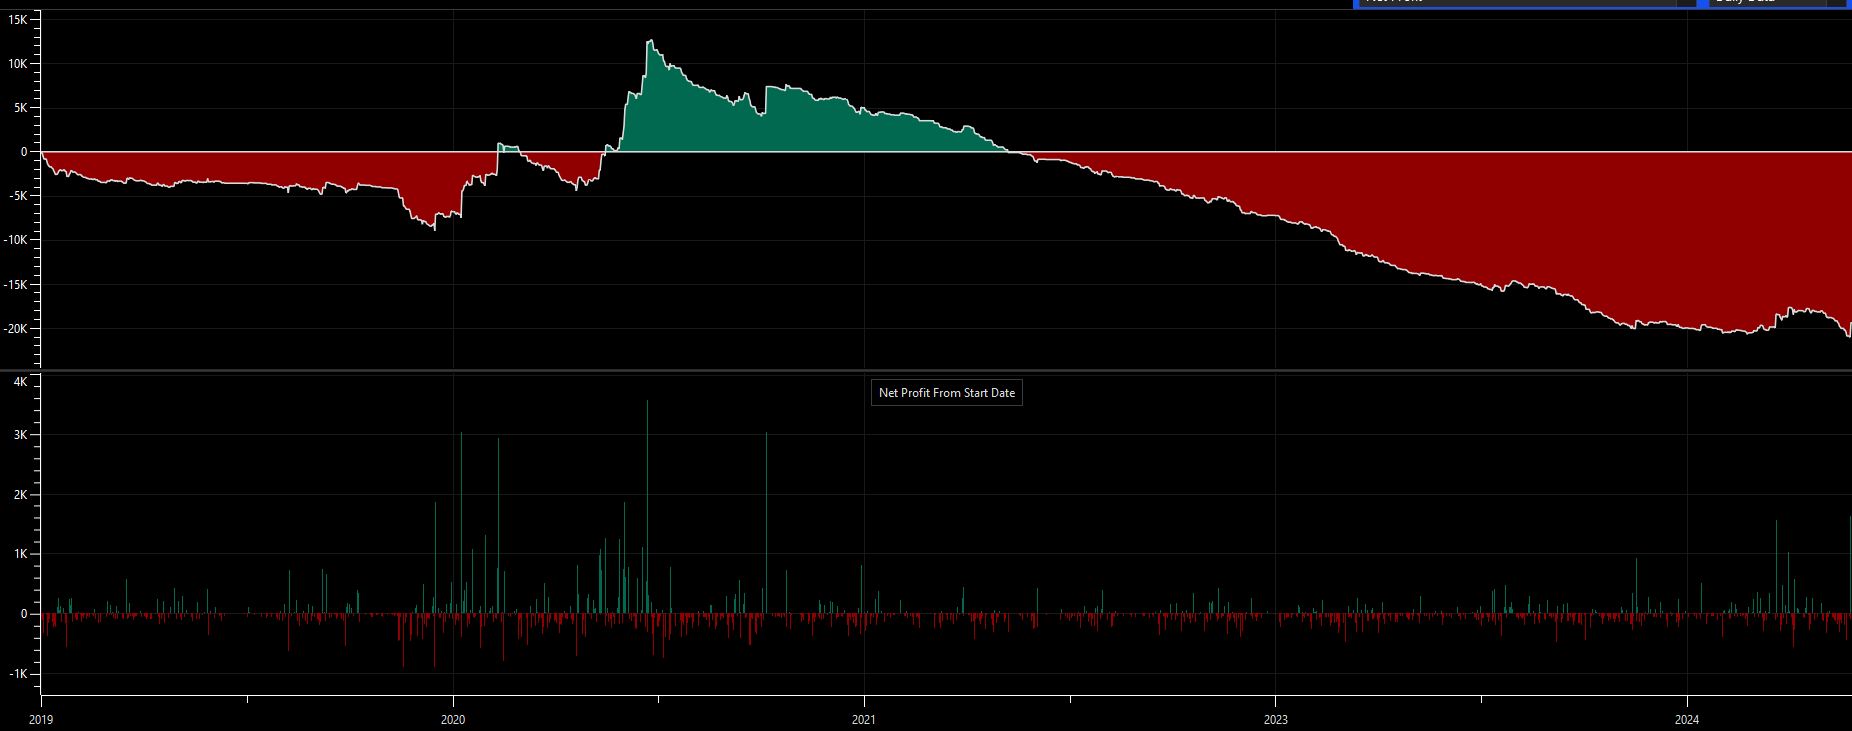
Here’s the backtest curve for this strategy, and you’ll immediately see that something’s wrong:
That less-than-perfect dataset has shown its teeth. In particular, the huge jump at the end of 2021 is probably caused by a reverse split. No, the stock price didn’t simply jump 100x overnight, which is what my dataset implies… The good news that even if I remove the ~50 top winners in my backtest (not all of which are errors), it still comes out profitable. Even better, it’s fairly uncorrelated to the first strategy – especially evident if you look at 2022-23:
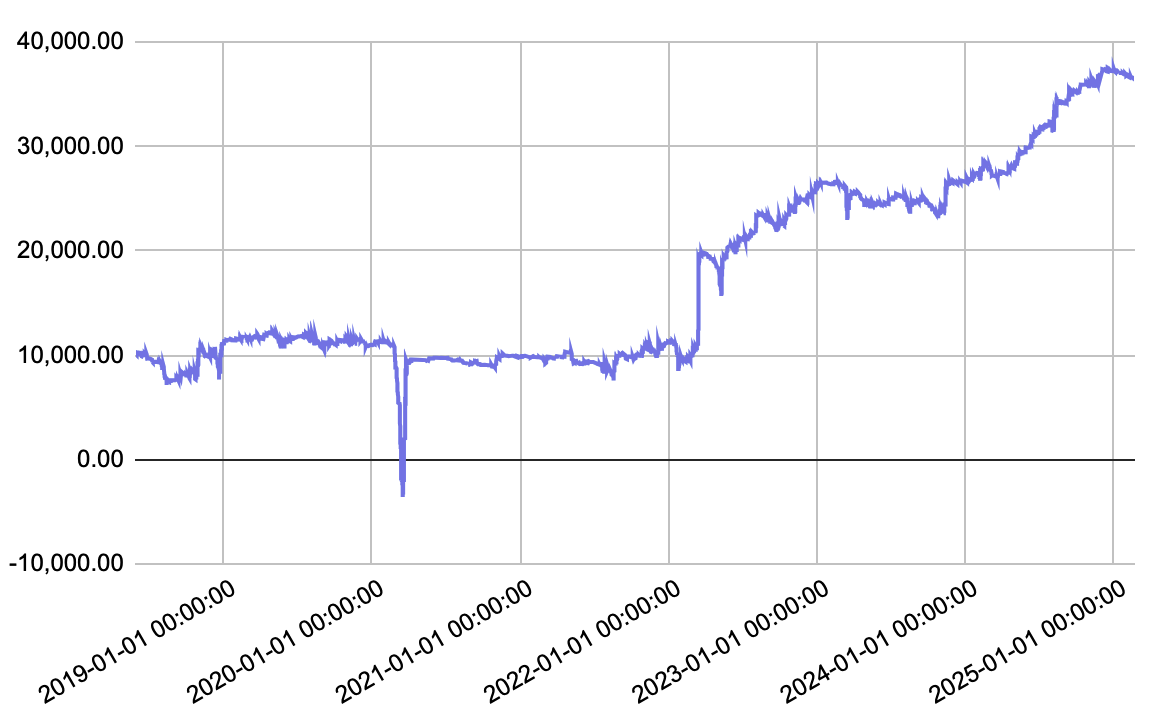
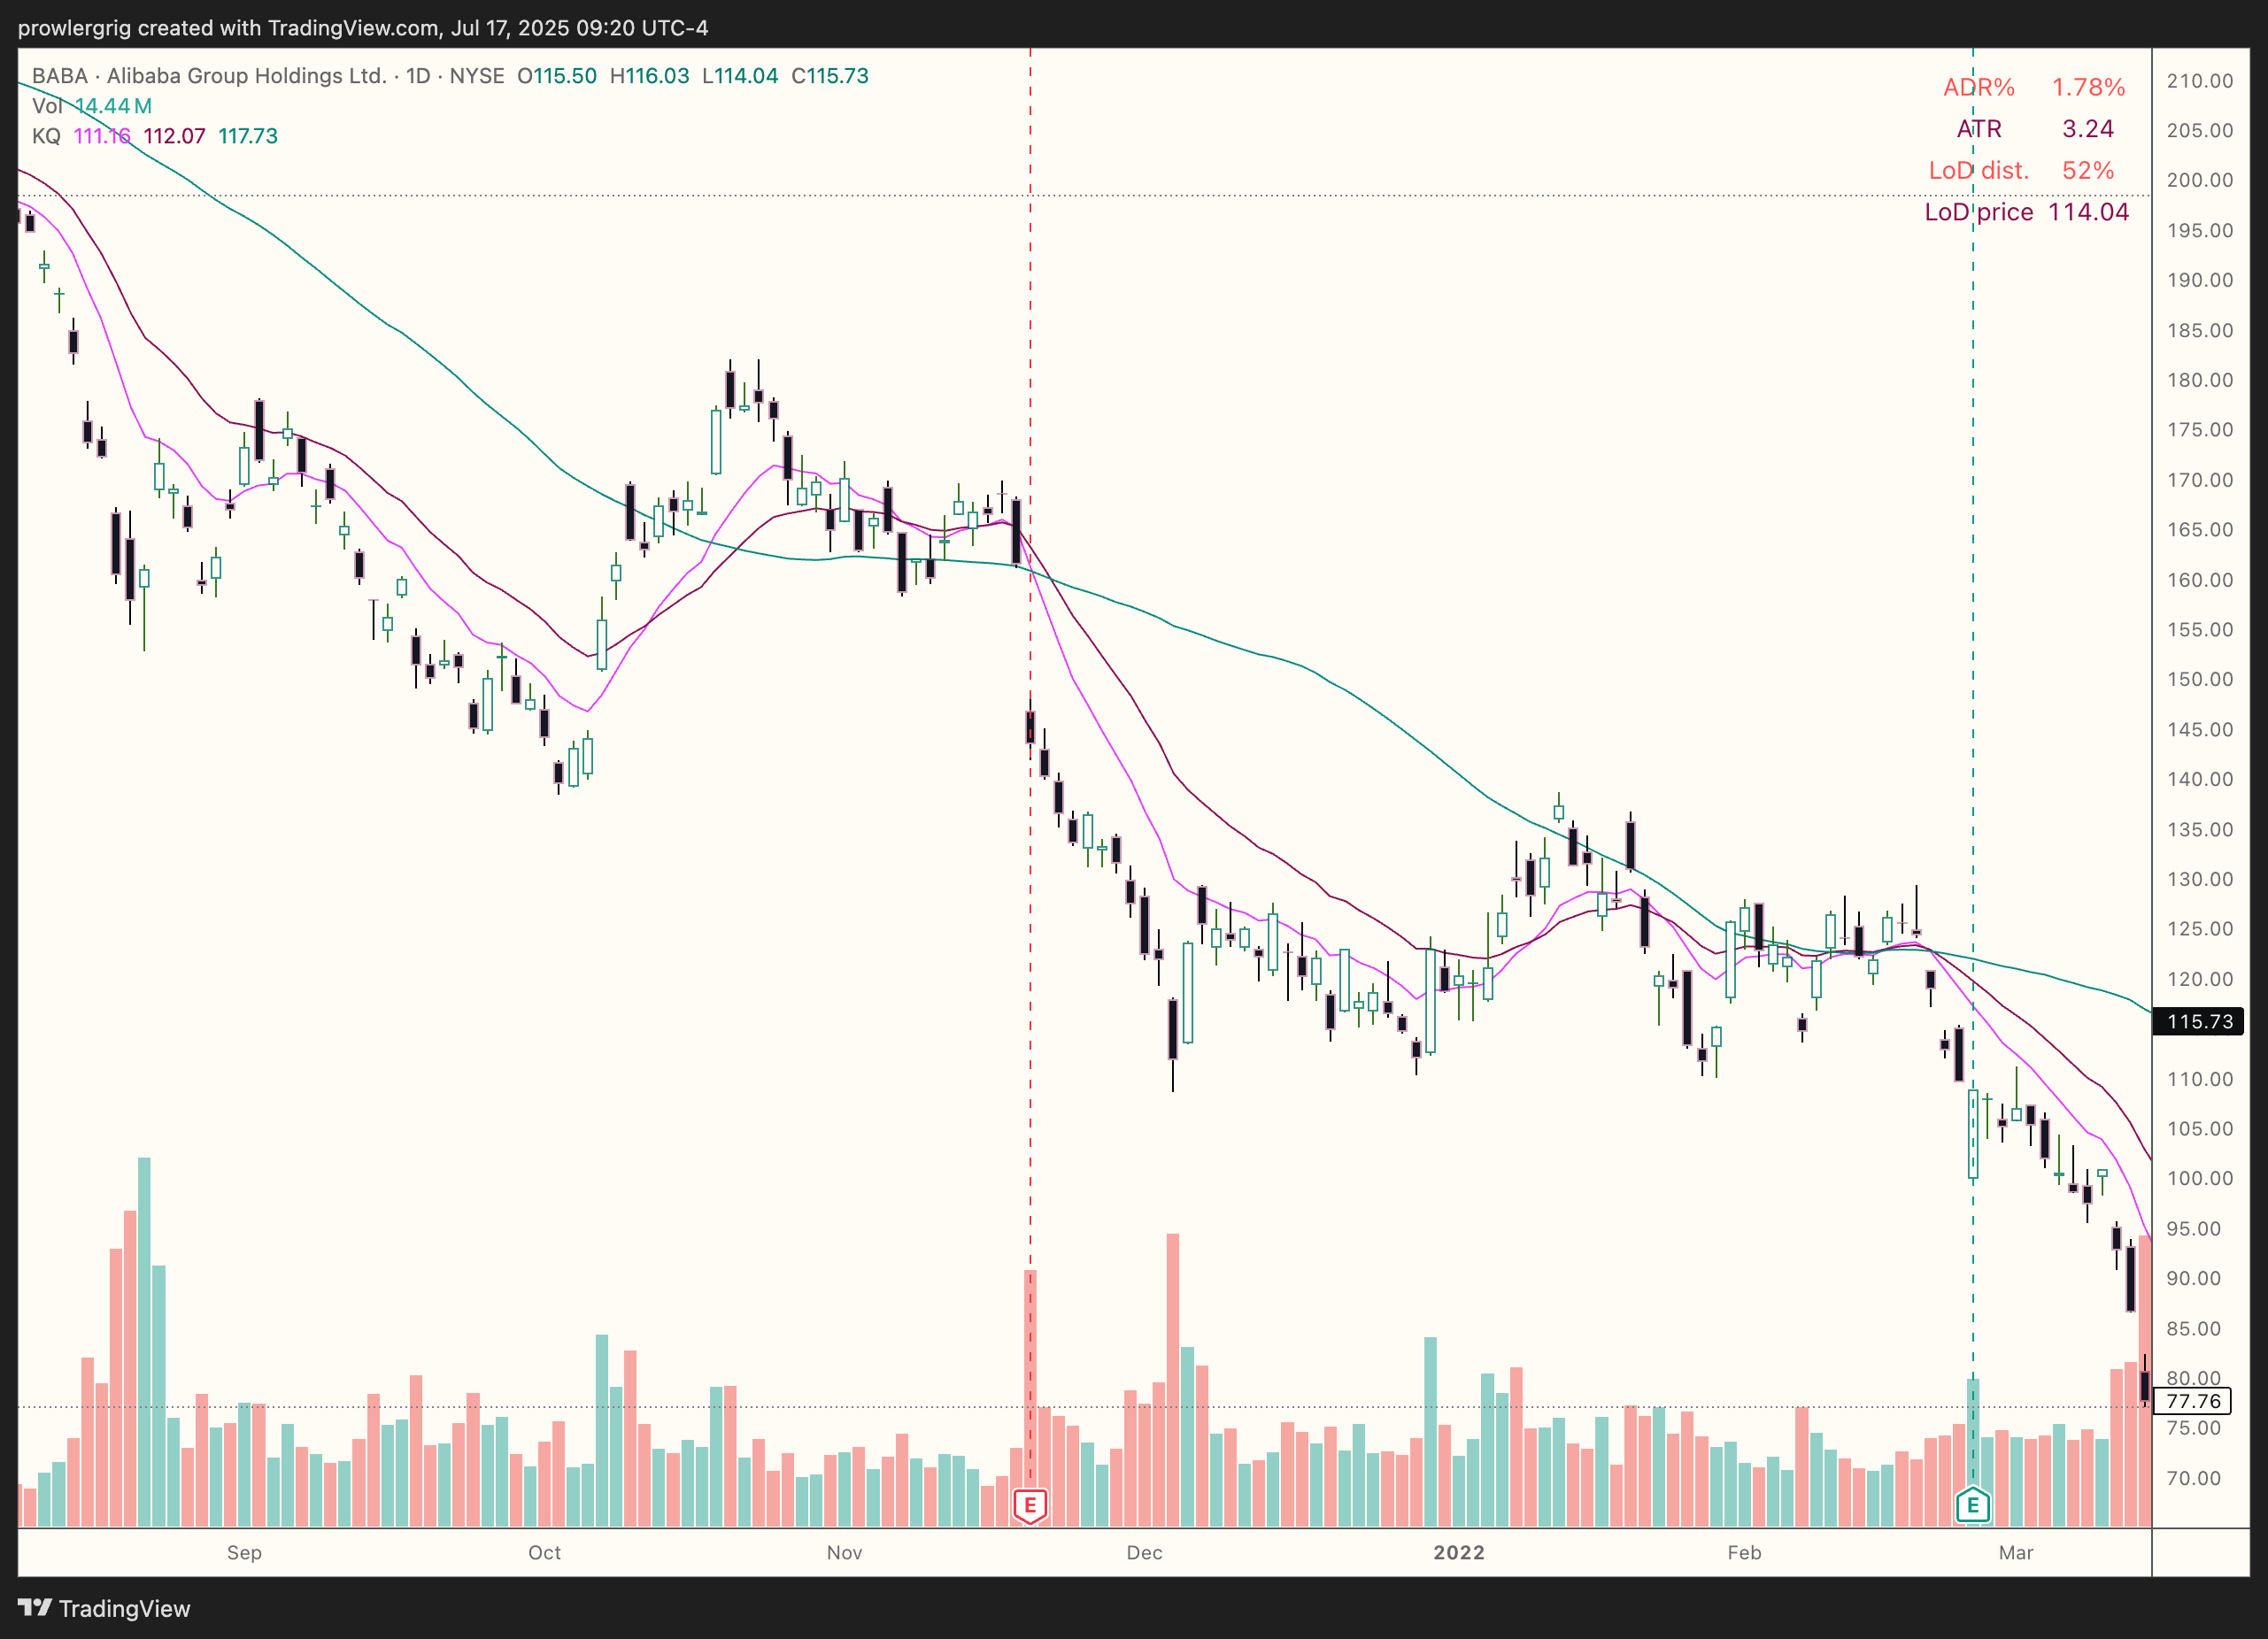
But there’s another serious issue: on the fateful day of 13 March 2020, we enter a bunch of losing trades. Here’s what one of them looks like:
I noticed that the damage wouldn’t be as bad if we used the low of the entry day as the stop loss level. Let’s redo the backtest with this modification in place, and again remove the ~50 biggest outlier wins:
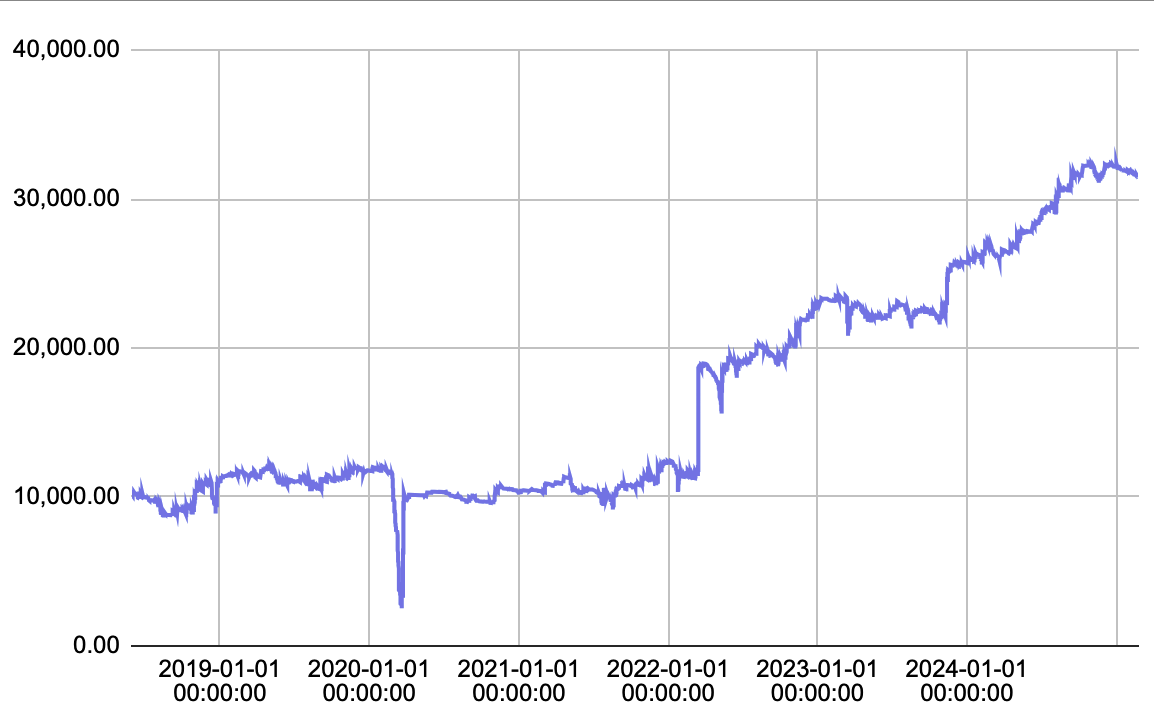
This is good enough, I think. It’s important to know that that huge drop isn’t caused by a single trade, but dozens, with the exposure on that day (just from this strategy) being around 300%… so realistically not all of those trades would’ve been executed. It’s a black swan risk that must be taken into account.
Here, check for yourself. Here are the backtest trades for strategy one and for strategy two.35
I would say such a combination of two uncorrelated strategies, one going with the trend and another against it, is the bare minimum required for a pretty smooth and robust system. I do intend to go back and add more strategies, when I have more time and a larger account. Some ideas I’d like to try:
- quick (1-3 days) small cap trades, both long and short. There are many options out there for this, a couple of which I’ve researched already. They involve executing (and maybe scanning) on an intraday basis.
- parabolic short. More common than the para long (my strategy #2), but arguably riskier.
- continuous trend following of sector ETFs, or maybe even futures, a la Rob Carver.
But for now, let’s stick with the two strategies outlined above: the breakout and the parabolic. They each provide daily lists of candidates, to be bought at the end of the next day if the trigger condition is met. Bought, where? To place trades you need to sign up to a broker. If you’re in the US you have a bunch of no-commission stock brokers at your disposal;36 otherwise the choice is simple: Interactive Brokers. Not only do they offer decent trading costs, but the IB API is a very powerful and pretty stable way to automate your trades. So we’ll use the following software:
- IB Gateway, a minimalist, lightweight bridge between your scripts and Interactive Brokers.
- TWS, the online client portal, or the IBKR mobile app, to track your portfolio and stats.
Again, to implement the algo via the IB API, we use Python. Since so far both my strategies are executed at the close of the trading day, I only need one script which first manages any existing positions (I keep a csv file for each open trade, and when I exit I log the trade data to a trades.csv) and then opens new positions. Then, right after market close, another Python script pulls the new daily price data37 for all stocks38 and then runs my scans. Both Python scripts log information to Git and also notify me by email.
Of course, executing these scripts is a matter of pressing 2 buttons on a keyboard, but I just had to go all the way and buy a little N100 Mini PC,39 install Linux and set everything up to run automatically.40
For IB Gateway run autonomously, almost without assistance (you’ll just have to do the 2FA on your phone every Sunday morning), use IBC. It’s a pretty straightforward install; I just ran into the regular Linux trouble with user permissions, which chatgpt helped me sort out.41
To schedule all these programs to run regularly at set times, under Linux you use crontab, which can be edited using this command:
sudo crontab -u $(whoami) -e
My crontab file ended up looking like this:
45 22 * * 1-5 /home/rv/Documents/systematic/cron_10_live_eod_linux.sh >> /home/rv/Documents/systematic/10_live_eod_output.log 2>&1
15 23 * * 1-5 /home/rv/Documents/systematic/cron_get_data_linux.sh >> /home/rv/Documents/systematic/get_data_output.log 2>&1
0 2 * * 2-6 /home/rv/Documents/systematic/cron_download_nasdaq.sh >> /home/rv/Documents/systematic/download_nasdaq.log 2>&1
5 2 * * 2-6 cd /home/rv/Documents/systematic/ && git pull && git add . && git commit -m "Auto-commit logs" && git push >>  /home/rv/Documents/systematic/git_cron.log 2>&1
0,15,30,45 * * * 1-5 export DISPLAY=:0 && /bin/bash /opt/ibc/gatewaystart.sh
So, am I rich yet? Hell no, I’m still running the thing on demo to sort out any remaining bugs, before I deploy it starting on the minimum risk setting. But I’ve finally got some peace of mind and can start worrying about other things.
-
I use this loaded term on purpose. Of course the vast majority of trading globally is done “online”; professionals don’t use physical trading floors anymore either. But if the words “online trading” sound to you a bit like “online gambling”, then you’re on the right track. ↩
-
OK maybe THIS is the point where any sane person will say “oh fuuuuck offff” and close the tab. If you feel this urge but are resisting it, ask yourself why. Is it maybe a bit of greed? In my case it was. And it sucks. Greed is a generally toxic sentiment that’s made our societies and relationships worse for at least 100 years. And in trading, while it works as a primary motivator, perversely greed (coupled with lack of patience) is also pretty disastrous. Enlightened influencers will tell you the best we can do is channel our personal wealth accumulation towards nobler causes. But the fact remains, there’s a fine line between wanting a comfortable life and greed, and continuous accumulation is NOT a sane way to live. Hence why I feel so guilty getting myself involved in all of this. ↩
-
Technical analysis (TA for short) attempts to forecast future prices based on historical price and volume values, i.e. what the market has printed on a price chart. For smallfolk like you and me, who can’t and/or won’t read companies’ financial balance sheets or listen to shareholder calls (I’m embarrassed to even know what these are) 95-100% of the information you need to make trading decisions is derived from price, volume and time. (the remaining 0-5% includes stuff like earnings dates and numbers, news and other fuzzy oddities of the market). So all of the resources and methods in the rest of my post deal with technical trading exclusively. ↩
-
where the trading system you design involves certain decisions that you, the human trader, must make. These might involve intuition, logic, or other practical skills you develop on the job. ↩
-
at least if we don’t count his paid services, which I (obviously) haven’t tried. ↩
-
“Edge” in trading lingo describes a strategy with positive expected value: if you follow such a strategy then, over the long run, your account is expected to grow. ↩
-
Yes I’m being facetious, but I’d be lying if that didn’t draw me in the first time I saw it. Did I mention I’m a greedy fuck? That’s right. I only admit it here in the footnotes, but it’s true. And you there, still reading along, you’re a little greedy fuck too aren’t you? We’re part of the same club. Disgusting, it’s what it is. ↩
-
but he is slated to appear in the upcoming Market Wizards book by Jack Schwager. ↩
-
the last of which resulting in suicide. ↩
-
A typical trader tweet boasted about the Gladwellesque tens of thousands of hours of looking at charts it took to achieve “superperformance”, followed by the myriad of replies encouraging the OP to “keep crushing it bro” and the like. A single reply dared to suggest that mayyybe spending years looking at lines on a screen is perhaps not the most rewarding way to spend your youth. You can guess what the reactions were. ↩
-
I’ve been trading US stocks for reasons similar to Qullamaggie or LanceB. Similar principles apply to other assets, like commodities, bitcoin etc. Forex prices behave a little differently and arguably it’s harder to find edge there, although some people obviously do it. More info on trading different asset classes is in the references I mentioned, particularly Adam’s book and blog, and Rob’s book Leveraged Trading. ↩
-
Of course it’s not that simple, it never is. There are at least two things to bear in mind when looking at a historical chart. 1) how did it perform against the index, i.e. the average of all stocks? Maybe your stock rose 10% (yay!) but in that same period, the stock market (or the sector this stock is a part of) rose 15% (oops!?) – this means your pick shows relative weakness, which doesn’t bode well for its performance moving forward. 2) markets are probabilistic: just because a stock behaves well on a particular occasion doesn’t mean it will repeat that in the future. This is why you need multiple instances to validate your idea, and to not rely on flukes and outliers. These are important statistical concepts that both Adam and Rob cover quite well in their work. ↩
-
Speaking of which, pretty much EVERYTHING I discuss in this post is being automated with AI at the big trading firms. Which of course leads to the serious question whether (or when) individual humans will be replaced by AI in this field, just like in so many others. If all this wasn’t depressing enough already. ↩
-
at least if you’re using daily price data. I got 6 years of daily data and was still left enough free credits to download ~3 years of hourly data, which I feel bad for not having yet used. You can of course choose to get more granular, but it can get expensive and resource-intensive pretty fast. ↩
-
Aside from the three trading books I’ve already linked in the main text, Rob Carver also wrote a book on systematic portfolios. For most people this blog post on the topic should be enough, though. ↩
-
Your position size is the amount of units (e.g. shares of a stock) you’re buying (or selling, if going short) at any time. For most people, this will depend on a combination between your forecast (will the stock go up?) and volatility (how much will it move?). In Rob’s case, he uses dynamic position sizing, which means he’s periodically adjusting his exposure, as opposed to the more traditional (and common in the retail space) method where you enter your desired size (depending on the strategy, you might enter using several different buys), and then hold it until your exit (again, you might exit in stages. Or you might add to your position at certain key spots along the way). I’ve toyed with implementing dynamic sizing but I think the trading costs make it too expensive for my case. ↩
-
Again, Rob writes a lot about strategy (and instrument) diversification. You really shouldn’t try any of the stuff I’m describing here without doing the reading first. ↩
-
As I was writing this, one of these platforms switched to a free of charge model. I’d really like to try it, but reimplementing my scans and trade logic in C# will take a while. I will eventually get to it, and probably switch over, as it’s a much more powerful backtesting system than what I can build. Being platform-independent has its advantages, but it’s probably not worth the effort if there’s a no-cost alternative. EDIT ONE MONTH LATER: I made the switch, see the main text. ↩
-
or combining different timeframes, or using dynamic sizing, or who knows what other features you might dream up. ↩
-
This is apparent in many successful traders, some of which (consciously or not) try to counterbalance it with some kind of self-expression, or philanthropy. Which they often reduce to pure optimization problems as well. ↩
-
I shouldn’t have to explain how dumb and sad this is. I mean, sure, a trading community is better than no community. But this is your money you’re playing with. And if access to that “community” is something you’re also paying for, then you should ask your self some seriously hard questions. But there’s a more insidious layer here: there are (supposedly successful) traders on Twitter who do argue that trading shouldn’t be fun. Yet there they are, clearly deriving satisfaction from, at the very least, imparting their wisdom on the topic. And yeah, I’m doing some of that here too. Fuck. ↩
-
I could include machine learning algorithms here too. So an AI vision system can detect cancer at superhuman rates, but it can’t see Minervini’s volatility contraction pattern on a price chart? Right. ↩
-
For example, Adam Grimes has done a lot of quantitative study of the markets and has automated a lot of his process, e.g. trading signal generation, with a proven edge. Yet he never commits to going fully systematic; I’m not going to speculate here as to why… ↩
-
This kind of logic is basically my position for why playing music with real instruments will always be the best, even if we augment it with technology. So yeah, it’s kinda about what you want to direct your humanity towards. ↩
-
This means that, when setups are triggered, I enter stocks in the order of their past performance. If I have no more money left to invest after executing the first trades, then the less performing stocks will not be bought. ↩
-
I depart here from Qullamaggie and most of his followers, who prefer earlier and tighter entries. I think waiting for the close adds confirmation (which is reflected in my backtested win rate stats), but of course I miss the first day breakout move. There’s always a tradeoff. ↩
-
This is equivalent to Rob Carver’s fixed position sizing model mentioned above, with a binary forecast: buy yes/no. Some discretionary traders advocate for adjusting your forecast (and thus position size) depending on the “quality of the setup” (e.g. LanceB’s exponential bet sizing) or on your recent trading performance (e.g. Minervini’s progressive exposure). I don’t think I have the infrastructure to properly systematize these without risking overfitting. ↩
-
which, of course, doesn’t mean you should exclude it from your backtest. It’s still useful to know how much of that windfall your strategy would have captured. ↩
-
but not too much. A strategy is robust only if small parameter changes don’t affect its character. So if I happened to find a “winning” combination I would have to treat it with major skepticism, and figure out a good reason why that one wins when its neighbors don’t. ↩
-
An equivalent tactic is to take a partial profit. I haven’t tested this because it would be tedious to code into my system (have I mentioned I’m lazy?) but I assume the backtest results would be similar. Something to look at when I move to Tickblaze, maybe. ↩
-
Actually, a quirk in my code made it so the stop loss moves to the first close price after the entry, which is sometimes a bit higher and sometimes a bit lower. As mentioned in a previous footnote, a strategy should be robust to minor changes like this one, and after testing both versions and seeing very close results, I decided to keep this small idiosyncrasy. ↩
-
These jumps are likely bigger than they’d be in real trading. My exposure in the busy periods of 2020-2021 jumps to 600-800% which is obviously unrealistic (anything over 100% means you’re trading on margin, usually brokers won’t let you go over 200%) and in reality many of those trades (not all of which end up as winners!) would not go through. ↩
-
One measure of what this grind does to your average retail trader is looking at the turnaround on the Qullamaggies discord: of all the people who joined mid-2021, how many people were still there in 2023? How many are left now? ↩
-
This involved a bunch of more-or-less tedious steps, from importing the price data, to reimplementing my indicators and strategies in Tickblaze’s C# API (a Python API is coming “soon” but who has time for that). The documentation is pretty thin, and ChatGPT didn’t take me very far, so I had to figure it out myself. A major nuisance is that market orders are executed on the open of the next day, which is not how I operate (I execute a few minutes before the daily close, to capture the close price as close as possible. Other major frameworks enable this “cheat on close” but Tickblaze seems not to) so my only solution was to modify my data so that the
Openprice is equal to the previousClose. Since I don’t use open prices anywhere else (including my indicators) this seems not to have messed anything up… except of course I don’t experience gap downs anymore. This sucks, I hope to find a better solution someday. For now, I try to mitigate it by using extended-hours stop limit orders, not great but better than nothing. ↩ -
You might wonder why the prices don’t exactly match those given by regular sources like tradingview or yfinance. This is possibly due to databento only looking at primary exchanges, which is most visible in the volume values, which are often much lower than those reported by aggregators like yfinance. Anyway, I don’t think it’s such a big deal. ↩
-
I believe that all got started with the Robinhood app. ↩
-
Sometimes the
yfinancePython package stops working, in which case the solution has been to update it to the latest version before calling the data download script. ↩ -
You can find updated lists for all NASDAQ and non-NASDAQ symbol names on this site. I’ve got a script that downloads them every weekend. ↩
-
This is the one I’ve got. In order to make the most of it, since it’s running 24/7, I also use it as a little media server via Jellyfin. ↩
-
Again, I’m repeating myself, but there are always cloud-based alternatives to installing everything locally. But will they also stream episodes of Columbo for me? ↩
-
Turns out these directories in my home folder were owned by
rootinstead of my user, so I had to change that. ↩